

Your accountant hands you the monthly Profit and Loss statement. You scan the top-line revenue and the bottom-line net income, but do you truly understand the story your p&l is telling? If you’ve ever felt a gap between seeing your financials and using them to make bold, forward-looking decisions, you’re not alone. For too many leaders, this critical report is a historical document, not the strategic blueprint for the future it’s meant to be.
It’s time to transform that document from a source of confusion into your most powerful leadership tool. This guide is engineered for CEOs who demand more from their data. We will move far beyond the basic definitions to empower you to master your Profit and Loss statement, translating every line item into actionable intelligence. You will learn to pinpoint opportunities for profitable growth, surgically manage costs, and gain the unwavering confidence that comes from making decisions backed by true financial clarity. Let’s unlock your business potential and turn your P&L into a true engine for growth.
Key Takeaways
- Transform your P&L from a historical report into a forward-looking roadmap that guides your most critical growth decisions.
- Move beyond simply reading numbers and learn the strategic questions a CFO asks to uncover hidden opportunities for profitability.
- Identify and avoid the common, costly interpretation errors that can silently sabotage your company’s financial health and derail growth.
- Decode the story your p&l is telling, from top-line revenue to bottom-line profit, to gain complete clarity on your business performance.
What is a P&L Statement? (And Why It’s Your #1 Strategic Tool)
Most business owners view their Profit and Loss (P&L) statement as a historical document-a compliance task for their accountant. This is a critical mistake. To unlock your business potential, you must see the P&L not as a report card, but as your primary strategic playbook. It’s the definitive scorecard of your company’s performance.
At its core, the answer to What is a P&L Statement? is that it’s a financial summary of your revenues, costs, and expenses over a specific period, like a month or a quarter. While an accountant sees it as a tool for tax compliance, a CEO sees it as a powerful instrument for decision-making. Its true purpose is to answer one fundamental question with absolute clarity: Is the business profitable?
The Three Core Financial Statements
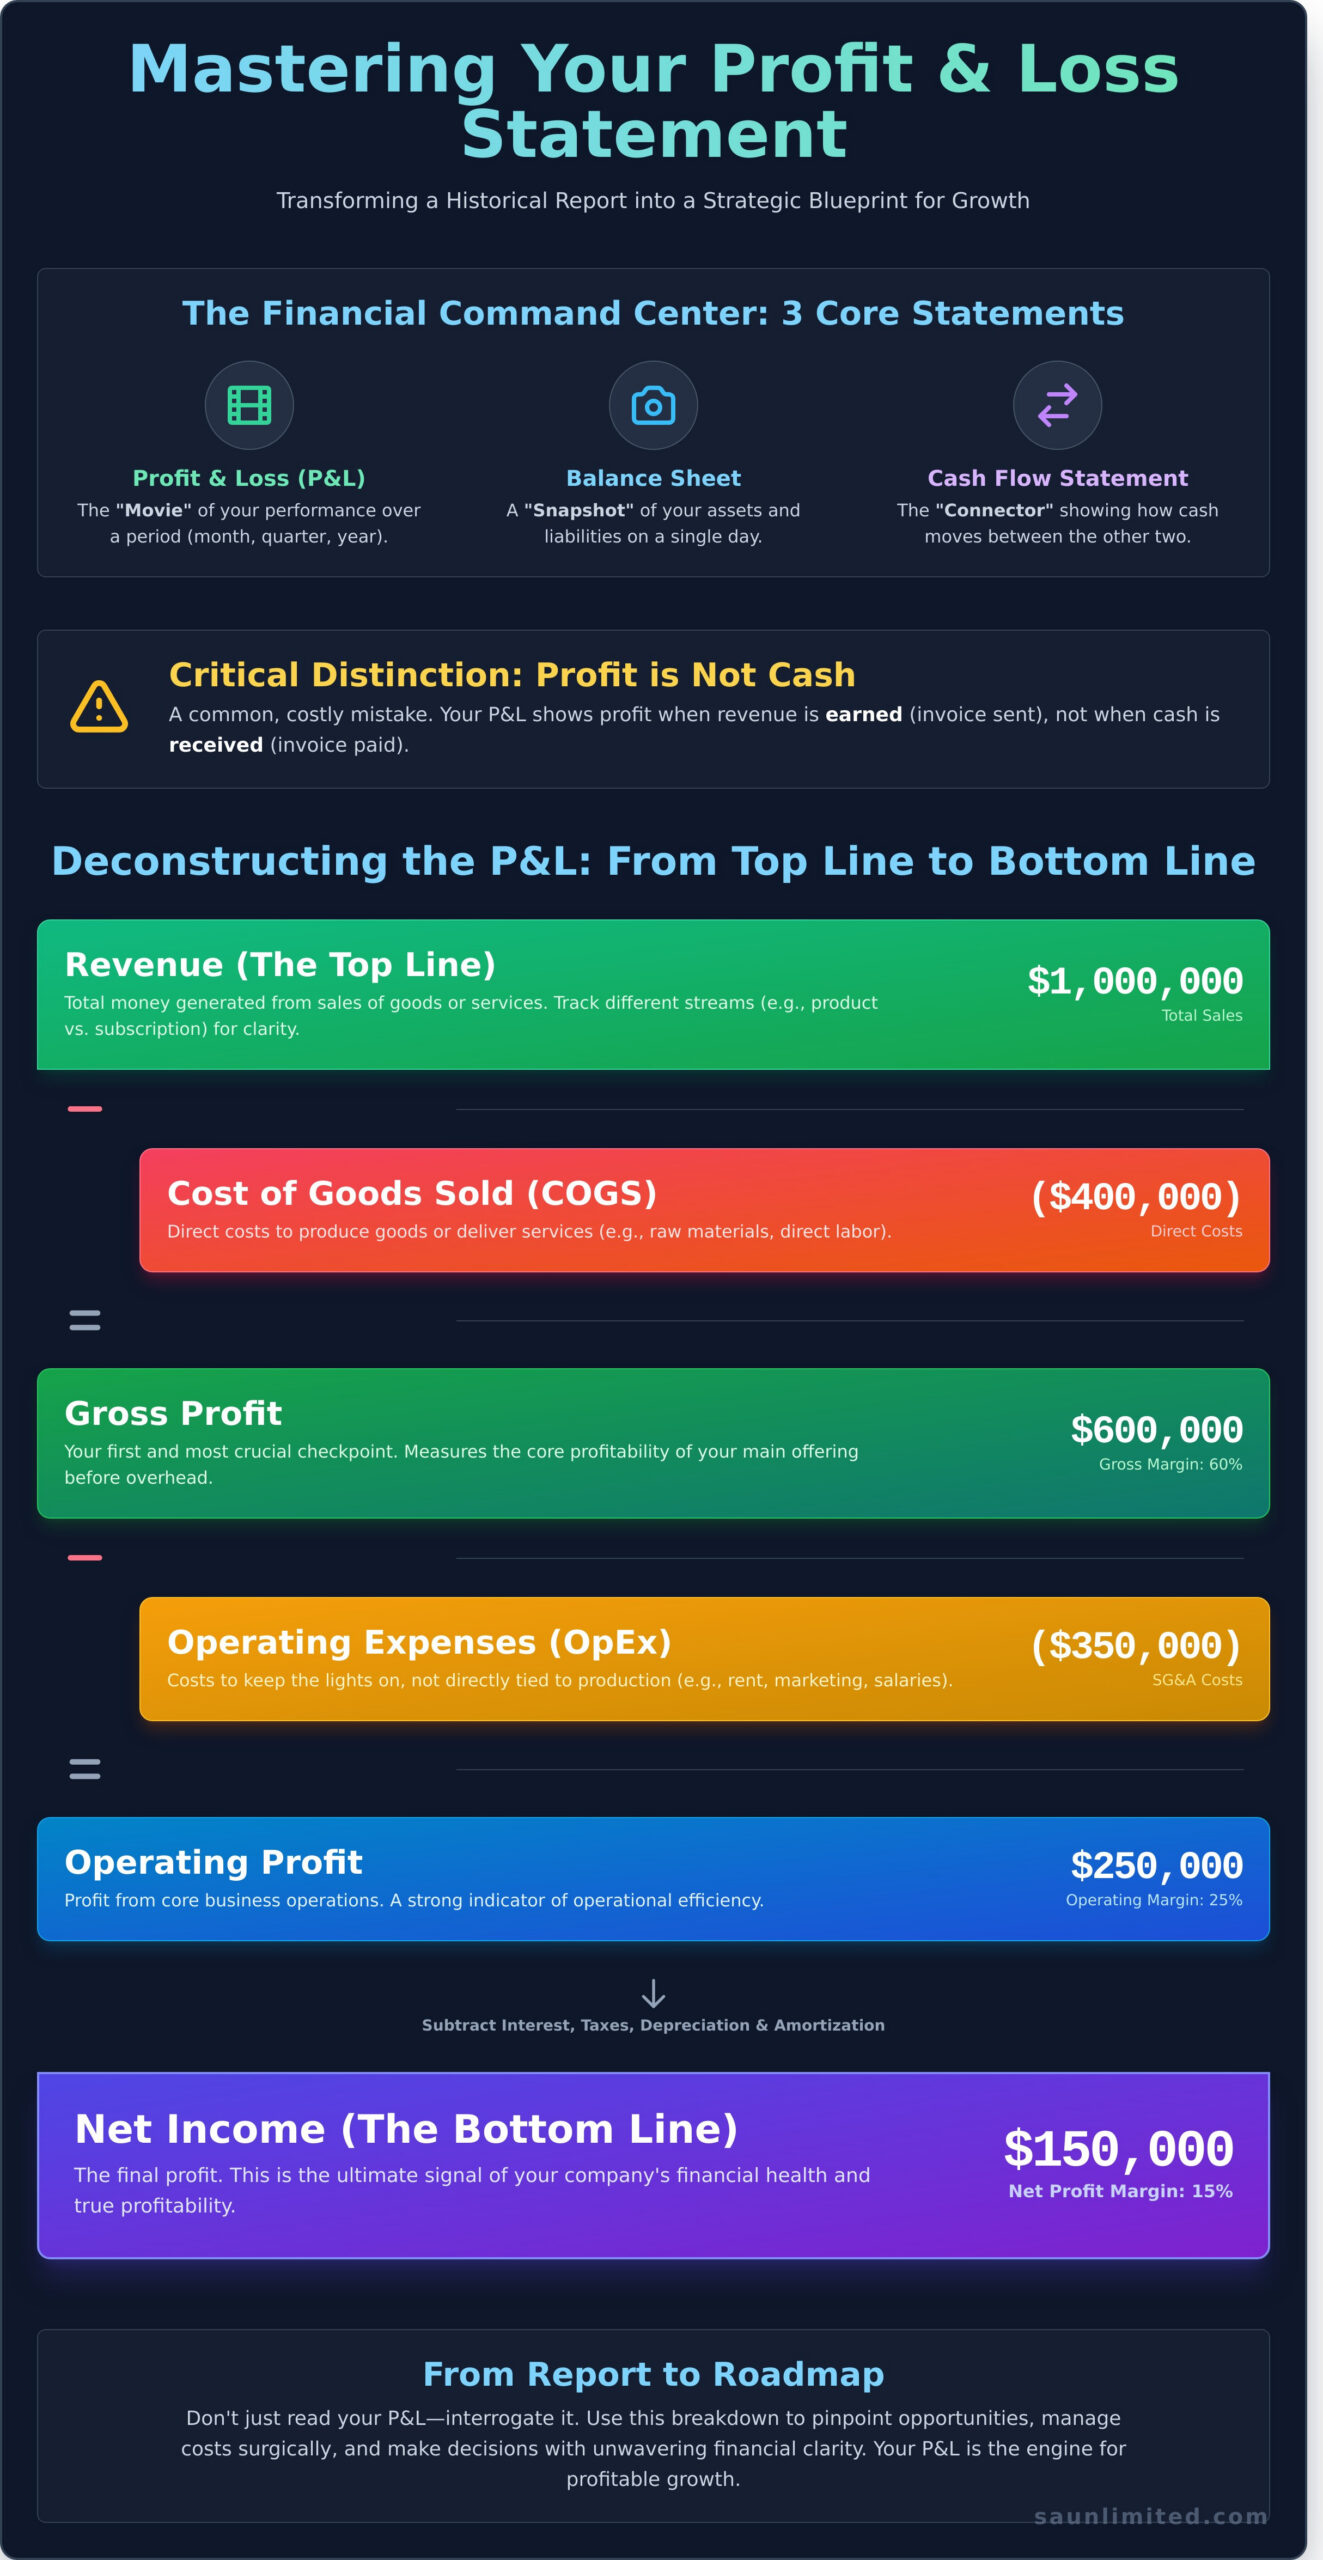
Your P&L is part of a powerful trio of financial reports. Think of it this way: the P&L is the movie of your business’s performance over time. In contrast, the Balance Sheet is a single snapshot of your assets and liabilities on one specific day. The third, the Cash Flow Statement, shows how cash moves between them. Together, they tell the complete financial story, but the P&L is the command center for analyzing and driving profitability.
P&L vs. Cash Flow: The Critical Difference for Founders
Here’s a lesson that can make or break a growing business: profit is not the same as cash. This crucial distinction comes from accrual accounting, where revenue is recorded when it’s earned, not when the money lands in your bank. For example, you close a $100,000 deal and send the invoice. That revenue immediately appears on your P&L, making you look highly profitable. But until that invoice is paid, you don’t have the cash. Understanding this gap is mission-critical for managing operations and funding future growth.
Deconstructing the P&L: From Top-Line Revenue to Bottom-Line Profit
A Profit and Loss statement is more than just a list of numbers; it’s a strategic narrative that tells the story of your business’s performance over a period. Each line item builds on the last, systematically calculating your journey from gross sales to the ultimate net profit. Understanding this flow is the first step toward mastering your financial destiny and unlocking your business potential.
Revenue (The Top Line)
This is your starting point-the total amount of money generated from sales of goods or services before any expenses are deducted. For true clarity, it’s critical to track different revenue streams separately (e.g., product sales vs. subscription fees). This top line is then adjusted for deductions like sales returns or discounts to arrive at your net revenue, the real starting block for calculating profitability.
Cost of Goods Sold (COGS) & Gross Profit
COGS represents the direct costs attributable to producing your goods or delivering your services. For a product business, this includes raw materials and direct labor. For a service business, it might be the salaries of your front-line delivery team. Subtracting COGS from Revenue gives you Gross Profit. This is your first and most crucial checkpoint, revealing the core profitability of your primary offering before any overhead is considered.
Operating Expenses (OpEx)
Think of OpEx as the costs required to keep the lights on-they are not directly tied to creating a product but are essential for running the business. These are often grouped into Selling, General & Administrative (SG&A) expenses and include everything from rent and utilities to marketing spend and executive salaries. A disciplined analysis of your OpEx reveals the true efficiency of your day-to-day operations.
Operating Profit, EBITDA, and Net Income (The Bottom Line)
Here, the story concludes. Operating Profit (Gross Profit – OpEx) shows what your company earned from its core business operations. From here, many leaders also look at EBITDA (Earnings Before Interest, Taxes, Depreciation, and Amortization) to gauge operational cash flow. But the ultimate measure is Net Income. After subtracting interest, taxes, and all other expenses, this is the “bottom line”-the final profit that signals the true financial health of your enterprise. Understanding these metrics is essential when you Analyze Your P&L Like a Strategic CFO, as each reveals a different layer of your company’s performance.
How to Analyze Your P&L Like a Strategic CFO
A static profit and loss statement is a missed opportunity. A strategic leader doesn’t just read the numbers; they interrogate them to uncover the story of their business. It’s time to transform your p&l from a rearview mirror into a high-performance dashboard that drives confident, forward-looking decisions. The goal is to move beyond what happened and start dictating what happens next by asking the right questions about trends, risks, and hidden opportunities.
Vertical Analysis: Understanding Your Margins
Vertical analysis reveals your company’s financial DNA by expressing every line item as a percentage of total revenue. This shows you exactly where each dollar earned is going. Focus on three critical margins:
- Gross Profit Margin: This measures the core profitability of your products or services before overhead. A low or declining margin may signal pricing pressure or rising production costs.
- Operating Profit Margin: This shows your company’s earning power from its primary business operations. It reflects how efficiently you manage day-to-day expenses.
- Net Profit Margin: The bottom line. This is what’s left after all expenses, including taxes and interest, are paid. It is the ultimate measure of your business’s overall profitability.
Horizontal Analysis: Tracking Performance Over Time
This is where you spot the narrative in your numbers. By comparing your P&L statements across different periods (month-over-month or year-over-year), you can identify crucial trends. Are your operating expenses growing faster than your revenue? Is your gross margin shrinking? This comparative view allows you to catch negative trends before they become critical problems and provides the hard data needed to set ambitious but achievable growth targets for the future.
Using Your P&L for Budgeting and Forecasting
Your historical performance is the launchpad for your future growth. A detailed p&l provides the essential baseline for building accurate budgets and powerful financial forecasts. By understanding your past revenue trends and expense structures, you can model different scenarios and make proactive, data-driven decisions. This process turns financial planning from a guessing game into a strategic exercise in creating your company’s future. Building a powerful forecast requires expertise. We solve for yes.
Common P&L Mistakes That Can Sink a Growing Business
A pristine Profit and Loss statement can feel like a map to success, but hidden dangers lie in misinterpretation. For ambitious founders, these aren’t just accounting errors; they are strategic blind spots that can derail growth before it truly accelerates. Understanding your p&l means sidestepping the common pitfalls that leave less-prepared leaders scrambling.
Mistake #1: Confusing Profit with Cash
This is the classic trap. Your P&L shows a $50,000 net profit for the quarter after landing a huge new client. But that client has 60-day payment terms, and you just paid your suppliers and team. On paper, you’re profitable. In reality, your bank account is empty. Profit doesn’t pay the bills-cash does. True financial clarity comes from analyzing your P&L alongside your Cash Flow Statement to get a complete picture of your company’s health.
Mistake #2: Misclassifying Costs (COGS vs. OpEx)
Incorrectly categorizing a marketing salary (Operating Expense) as a Cost of Goods Sold (COGS) instantly distorts your Gross Margin. This single error can lead you to believe your core product is less profitable than it is, triggering flawed decisions on pricing, production, or even strategy. The rule is simple:
- COGS: Direct costs to create and deliver your product or service.
- OpEx: Costs to run the business, regardless of sales volume.
Getting this right provides the clarity needed to make confident, data-driven moves.
Mistake #3: Ignoring ‘Below the Line’ Items
Many leaders focus exclusively on revenue and gross profit, but the story doesn’t end there. “Below the line” items like interest on debt, taxes, and non-cash expenses like depreciation are critical. Depreciation, for example, reduces your taxable income and reflects the real-world declining value of your assets. Ignoring these factors gives you an incomplete and dangerously optimistic view of your true bottom-line profitability. To unlock your business potential, you must command the entire financial narrative. Expert guidance ensures you never miss a critical detail.
From Report to Roadmap: Activating Your P&L for Growth
You now understand the components of your Profit and Loss statement. The critical shift for any founder or CEO is to stop seeing it as a historical record and start wielding it as a strategic weapon. This document isn’t static; it’s a dynamic guide that reveals the narrative of your business-what’s working, what’s broken, and where your greatest opportunities for profitable growth lie. True command of your business comes from translating these numbers into decisive action.
Implementing a Monthly P&L Review
Transform data into decisions by establishing a non-negotiable monthly financial review. This meeting moves your p&l from a spreadsheet into the strategic heart of your operations. A simple dashboard visualizing trends in revenue, gross margin, and net profit can make this process incredibly powerful.
Your agenda should be focused and actionable:
- Performance vs. Plan: How did our actual results stack up against our budget and forecast?
- Key Trend Analysis: Are Gross Profit Margin and Net Profit Margin improving or declining? Why?
- Expense Scrutiny: What are our top three operating expenses, and are they delivering a clear ROI?
- Strategic Action: Based on this data, what is the single most important financial decision we must make this month?
When to Bring in a Fractional CFO
As your business scales, so does its complexity. The questions you need to answer evolve from “Did we make a profit?” to “How can we fund our expansion while increasing enterprise value?” This is the inflection point where you need more than a report; you need a strategic financial partner.
A Fractional CFO moves beyond historical analysis to provide forward-looking guidance. They don’t just interpret your numbers-they help you architect a financial future, model scenarios, and build pathways to “Yes” for your most ambitious goals. They unlock the full potential hidden within your financial statements, providing the clarity and confidence you need to make bold, strategic moves. If you’re ready to transform your financial data into a definitive roadmap for success, it’s time to connect with an expert.
Transform Your P&L from Report to Roadmap
Mastering your profit and loss statement is not an accounting exercise-it’s a strategic imperative. You now have the framework to see beyond the numbers and recognize your P&L for what it truly is: a dynamic tool for forecasting opportunities, driving efficiency, and making bold decisions with unwavering confidence. By avoiding common pitfalls and embracing proactive analysis, you transform this document from a historical record into a powerful blueprint for sustainable growth.
But turning insight into action requires a seasoned partner. At SA Unlimited, we provide the strategic guidance behind $1B+ in successful transactions and have decades of experience scaling emerging and mid-cap companies. We don’t just read reports; we create pathways to “yes.”
Are you ready to activate your company’s full financial power? Unlock your business potential. Let’s build a strategic financial plan together.
Frequently Asked Questions About the P&L
What is the difference between an income statement and a P&L statement?
There is no functional difference. The terms ‘income statement’ and ‘P&L statement’ are used interchangeably to describe the exact same financial report. This crucial document summarizes your revenues, costs, and expenses over a specific period, revealing your company’s ultimate profitability. Think of them as two names for the same strategic tool, one designed to give you absolute clarity on your business’s financial performance and operational efficiency.
How often should a business owner review their company’s P&L?
To make strategic, data-driven decisions, you must review your P&L at least monthly. A monthly review provides a timely, high-resolution picture of your operational performance, allowing you to spot trends, manage costs, and pivot quickly. Waiting for quarterly or annual reviews means you’re reacting to old news instead of proactively shaping your future. Consistent review empowers you to stay in control and drive sustained growth with confidence.
Can I create a P&L statement myself using accounting software?
Absolutely. Modern accounting software like QuickBooks or Xero can automatically generate a P&L statement, providing instant access to your numbers. However, the real power comes not from the report itself, but from its strategic interpretation. A generated statement is only as accurate as the data entered. Partnering with a financial expert like Brown Hamilton Partners ensures your data is clean, your categories are correct, and you can unlock the powerful insights hidden within the numbers.
What is the difference between gross profit and net profit on a P&L?
Gross profit is your profit after subtracting the direct costs of producing your goods, known as Cost of Goods Sold (COGS). It measures your core product profitability. Net profit, the ‘bottom line,’ is what remains after all business expenses-including marketing, salaries, and taxes-are deducted from your revenue. Gross profit shows your operational efficiency, while net profit reveals the company’s true overall profitability after every cost is accounted for.
Why does my P&L show a large profit, but my bank account is empty?
This is a classic cash flow challenge. Your P&L records revenue when it’s earned, not when cash is received (accrual accounting). You might have significant accounts receivable (unpaid invoices) that look like profit on paper. Furthermore, the P&L doesn’t track cash movements like loan repayments or large asset purchases. Profitability and cash flow are two different, equally critical metrics. Mastering both is the key to sustainable financial health.
What is a good profit margin to aim for?
There is no universal ‘good’ profit margin; it varies dramatically by industry, business model, and company stage. A software company might see 80% gross margins, while a grocery store aims for just 2-3% net margins. The strategic goal is to benchmark against your specific industry averages and consistently work to improve your own metrics. The real question isn’t ‘what’s good,’ but ‘how can we optimize our profitability for maximum growth?’