
Your current data stack is likely costing you more in missed opportunities than it’s saving in automation. Most CFOs at scaling firms find themselves trapped between disconnected apps and “gut-feel” projections that fail to satisfy a boardroom. It’s frustrating to manage a high-growth enterprise while lacking a clear view of your future cash flow. You know that a robust kpi dashboard for growing business should do more than reflect the past; it must illuminate the path forward.
At SA Unlimited, we believe your numbers should empower you to make bold moves, not leave you second-guessing. We’re here to help you transform raw data into a strategic command center that ensures profitable scaling as you head into 2026. This guide will show you how to replace information overload with clarity, giving you the tools to unlock your business potential and improve EBITDA through better operational visibility. We’ll explore the essential architecture of a high-impact dashboard and the specific metrics that turn financial health into a competitive advantage so you can finally lead with unwavering confidence.
Key Takeaways
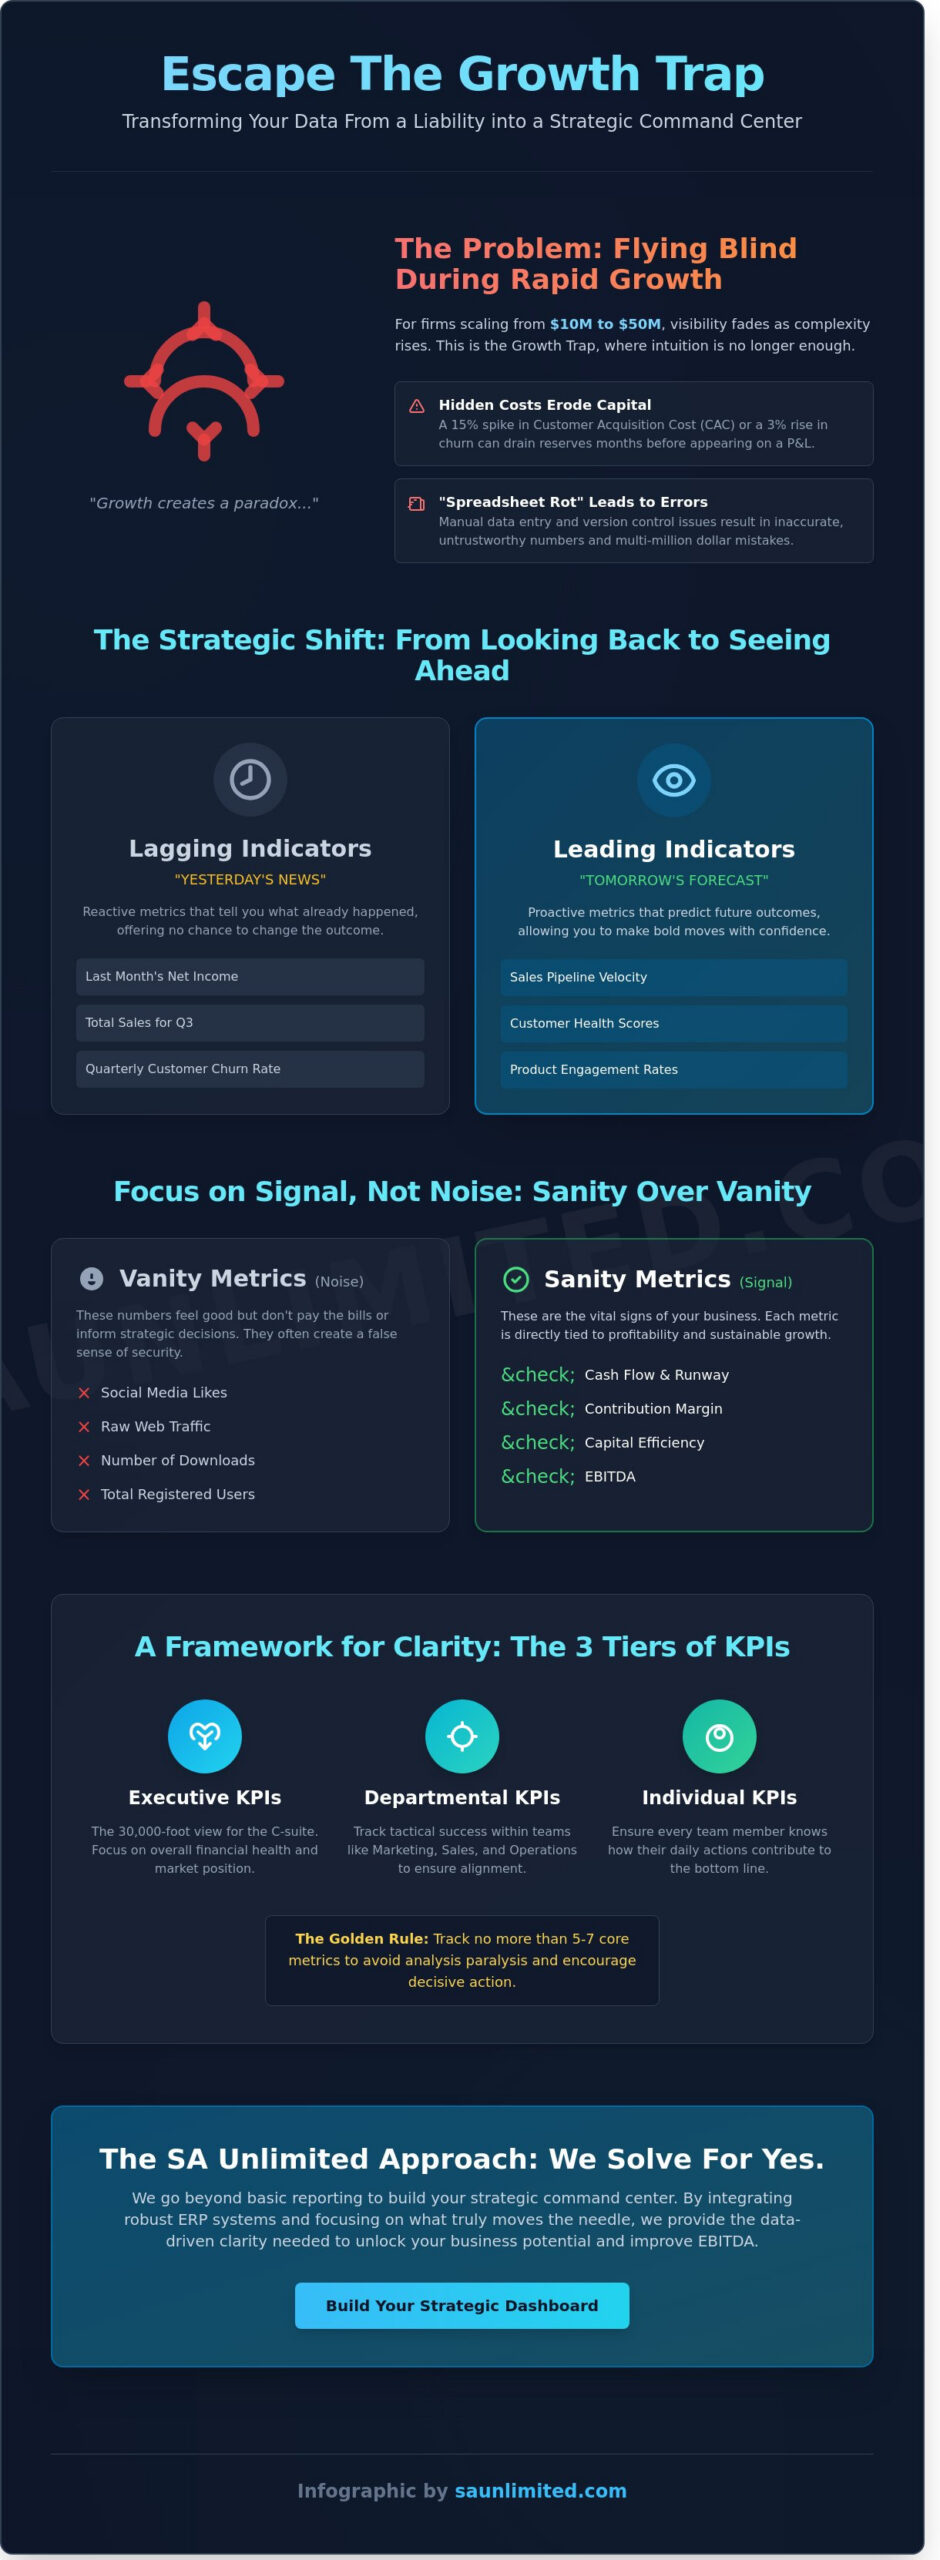
- Escape the “Growth Trap” by evolving from manual tracking to a real-time strategic command center that keeps pace with your scaling enterprise.
- Discover how to prioritize “sanity metrics” like contribution margin over vanity data to ensure every decision drives profitable growth.
- Learn how to eliminate data integrity issues by integrating a high-performance kpi dashboard for growing business with robust ERP systems.
- Master the “Management Rhythm” and variance analysis techniques needed to turn raw financial numbers into bold, proactive leadership moves.
- Unlock your business potential by partnering with strategic experts who “Solve for Yes” through data-driven clarity and cutting-edge technology.
The Growth Trap: Why Your Scaling Business Needs Real-Time Clarity
Every mid-cap enterprise reaching the $10M to $50M revenue mark eventually hits a ceiling. Growth creates a paradox. While your revenue climbs, your visibility into the specific levers driving that revenue often fades. This is the Growth Trap. It occurs when operational complexity outpaces a founder’s ability to track performance through intuition or manual logs. A kpi dashboard for growing business serves as your strategic command center, moving you away from guesswork and into high-stakes precision. We believe you should know your numbers with unwavering confidence.
The difference between a stagnant company and a market leader often lies in how they view data. Most businesses rely on lagging indicators. These are “yesterday’s news,” such as last month’s net income or total sales. While important, they don’t help you pivot in real time. High-growth firms prioritize a Performance indicator strategy that emphasizes leading indicators. These are tomorrow’s forecasts, like sales pipeline velocity or customer health scores. This clarity allows you to unlock your business potential by making bold moves based on facts, not feelings.
The Hidden Costs of ‘Flying Blind’ During Rapid Growth
Scaling without real-time data is a dangerous gamble. A 15% spike in Customer Acquisition Cost (CAC) or a 3% rise in monthly churn can erode your capital reserves months before they appear on a standard P&L statement. Many executive teams fall victim to “spreadsheet rot.” This happens when manual data entry leads to version control issues and human errors, often resulting in multi-million dollar mistakes. Professional fractional cfo services eliminate this risk by providing expert oversight and automated reporting. We roll up our sleeves to ensure your data is clean, accurate, and actionable.
From Basic Bookkeeping to Strategic Intelligence
Standard QuickBooks reports are baseline tools, but they are insufficient for companies scaling beyond $10M. At this level, you must transition from reactive accounting to proactive financial leadership. This requires a kpi dashboard for growing business that integrates diverse data streams into a single source of truth. Strategic intelligence means you no longer ask “what happened” but instead ask “what should we do next.” A Strategic KPI is a metric that directly triggers a management action. By focusing on these triggers, you create pathways for sustainable, profitable growth and empower your team to solve for yes in every department.
Selecting the Right Metrics: A Strategic CFO’s Framework for 2026
Growth without clarity is just noise. To scale effectively, you must move beyond vanity metrics like social media likes or raw web traffic. These numbers feel good but don’t pay the bills. Instead, your kpi dashboard for growing business should prioritize sanity metrics: cash, contribution margin, and capital efficiency. At SA Unlimited, we believe in the “We Solve for Yes” mindset. This means using data not to find reasons to stop, but to identify the specific pathways that lead to profitable expansion.
Effective leaders categorize their data into three distinct tiers. Executive KPIs provide the 30,000 foot view for the C-suite. Departmental KPIs track tactical success within teams. Individual KPIs ensure every team member knows exactly how they contribute to the bottom line. Research from Forbes suggests using a practical framework for defining KPIs helps maintain focus on what truly moves the needle. Remember, less is more. Tracking more than 5 to 7 core metrics usually leads to analysis paralysis rather than action.
The Financial Core: EBITDA, Runway, and Cash Flow
Profitability is the ultimate scorecard. This is why ebitda remains the gold standard for measuring a company’s operational performance. It strips away the noise of financing and accounting decisions to show if your core business actually works. For firms scaling at 20% or more annually, Cash Runway is your most critical survival metric. It dictates your timeline for capital raising or reaching break-even. You must track Gross Burn, your total monthly spending, alongside Net Burn, the actual cash lost after revenue is factored in. This distinction ensures you don’t run out of oxygen while climbing the mountain.
Operational Efficiency: CAC, LTV, and Pipeline Velocity
Scaling requires proof that your business model is sustainable. The LTV:CAC ratio is the heartbeat of this proof; a ratio of 3:1 or higher generally indicates a healthy, scalable machine. While many focus on total sales, Pipeline Velocity is a better predictor of future revenue because it measures how fast prospects move through your funnel. Contribution Margin is the true measure of product-level profitability, representing the revenue remaining after subtracting variable costs. If you want to unlock your full business potential, you need a strategic financial partnership that turns these numbers into a roadmap for success.
- Executive Tier: EBITDA, Cash Runway, Net Burn.
- Departmental Tier: Pipeline Velocity, CAC, LTV.
- Individual Tier: Quota attainment, task completion rates, unit efficiency.
Building Your Infrastructure: Data Integrity and Sage Intacct Integration
A high-performance kpi dashboard for growing business is a window into your company’s soul; however, if that window is dirty, you won’t see the obstacles ahead. We solve for yes by addressing the “Garbage In, Garbage Out” (GIGO) problem head-on. If your underlying data is fragmented or entered manually, your dashboard becomes a collection of polished lies. Your visual reporting is only as strong as your ERP system. It’s the foundation that supports every strategic move you make.
Automation is the secret weapon here. By removing manual data entry, you eliminate the 10% to 15% error rate common in spreadsheet-heavy environments. Real-time updates ensure that when a CEO looks at the screen, they’re seeing today’s reality, not last month’s history. This dashboard acts as the vital bridge between the technical accounting department and the CEO’s office, and when paired with the digital strategy and ICT expertise of Business Analysis & Solutions, it translates complex debits and credits into actionable growth metrics that drive confidence.
Leveraging Advanced Cloud Financial Management Systems
For businesses scaling past the $10M mark, a leading cloud financial management system provides the granular visibility needed to win. Its advanced data segmentation features allow you to tag transactions by department, location, or project without cluttering your chart of accounts. This enables granular reporting that identifies exactly which profit centers are performing. For companies with multiple locations, multi-entity consolidation happens in seconds, not days. This level of automation typically saves finance teams 20 or more hours of manual work every month, allowing them to focus on strategy instead of data entry.
The Role of the Implementation Partner
Don’t fall into the DIY trap. Setting up a complex kpi dashboard for growing business without expert guidance usually leads to broken data flows and unusable metrics. This is where cfo consulting becomes invaluable. A strategic partner ensures your entire tech stack, including your CRM and payroll, communicates seamlessly with your ERP. For those seeking to modernize their workforce infrastructure, you can visit Humae to see how AI-powered HR tools complement a high-growth data stack. We roll up our sleeves to design a system where every piece of software talks to the others, ensuring your data integrity remains bulletproof as you scale toward $100M and beyond. Knowing your numbers starts with a system that’s built to handle your ambition.
Turning Data into Decisions: How to Lead with Dashboard Insights
Your kpi dashboard for growing business is more than a display of colorful charts. It’s a high performance engine that requires a specific management rhythm to produce results. To lead effectively, you must move beyond glancing at numbers and start interrogating them. We recommend a three tiered review cycle: daily for triage, weekly for tactical adjustments, and monthly for strategic alignment. This structure ensures you don’t just react to the market; you anticipate it.
The real power of a dashboard lies in variance analysis. This technique forces you to look at the gap between your actual performance and your projected goals. If your revenue is 12% lower than forecasted, you need to know if the issue is lead volume, conversion rates, or average deal size. Understanding the “why” behind the numbers empowers you to make bold moves, such as hiring five new sales reps or expanding into a new territory, with total confidence. When you know your numbers, you eliminate the guesswork that slows down most CEOs.
The Weekly Pulse: Spotting Red Flags Before They Become Crises
Every Monday morning at 8:00 AM, your first priority is the dashboard. You aren’t looking for everything; you’re looking for anomalies. An anomaly occurs when a metric deviates by more than 10% from its 13-week moving average. This specific timeframe provides enough historical context to filter out noise while remaining current enough to signal a developing trend.
- Identify the Drift: If your Customer Acquisition Cost (CAC) spikes suddenly, investigate the ad spend or channel performance immediately.
- Enforce Accountability: Use the dashboard to hold department heads to their North Star metric. If the Head of Product sees a 15% drop in user engagement, that’s their primary focus for the week.
- Prioritize Action: Use the data to decide what doesn’t matter this week, allowing your team to focus on the 20% of activities that drive 80% of the growth.
Strategic Forecasting: Modeling the ‘What If’ Scenarios
Static annual budgets are relics of a slower era. Today, successful leaders use dynamic forecasting to stay agile. Your dashboard data should feed directly into the financial models built by your outsourced cfo. This allows you to run “What If” scenarios with surgical precision. If you lose your largest client representing 18% of your revenue, you can instantly see how that impacts your 12-month runway and hiring plans.
Ready to turn your data into a strategic weapon? Partner with SA Unlimited to unlock your business potential and lead with unwavering confidence.
The SA Unlimited Approach: We Solve for Yes with Strategic Clarity
A high-performing kpi dashboard for growing business requires more than just a software subscription. It demands a fusion of cutting-edge technology and seasoned strategic insight. At SA Unlimited, “We Solve for Yes” isn’t just a motto; it’s the mindset we bring to every client engagement. We don’t just hand you a login. We roll up our sleeves to ensure your financial data becomes a proactive engine for growth rather than a rearview mirror. We believe that clarity is the ultimate competitive advantage.
Unlock Your Business Potential by moving beyond basic reporting. Many leaders feel buried in spreadsheets without knowing which levers to pull to increase valuation. We bridge the gap between knowing the numbers and actually growing the business. We transform static data into a dynamic roadmap. This allows you to lead with unwavering commitment and the confidence to make bold moves. Your financial data should be your most valuable strategic asset, not a source of confusion.
Why a Fractional CFO is the Architect of Your Dashboard
A CFO doesn’t just monitor the screen; they build the underlying logic that makes the data meaningful. There’s a massive difference between a Controller and a Strategic CFO. A Controller focuses on historical accuracy and keeping the books clean. While that’s necessary, a Strategic CFO is forward-looking. They design your kpi dashboard for growing business to predict cash flow hurdles and identify profit leaks before they impact your bottom line.
- Top-Notch Talent: Access executive-level expertise without the $250,000+ full-time salary.
- Custom Logic: We build frameworks that track the specific drivers of your unique business model.
- Proactive Problem Solving: We identify obstacles and create pathways to overcome them.
Your Pathway to $1B+ Success Metrics
Our team brings a proven track record to the table, having contributed to over $1B in successful capital raises and corporate exits. This isn’t theoretical expertise; it’s battle-tested strategy. We understand what investors look for and what it takes to scale a company at high velocity. Our Unlimited Strategic Partnership model is built for companies that are ready to dominate their market and need a financial structure that can support that ambition.
We help you build a strategic command center that provides real-time visibility into your most critical metrics. Whether you are preparing for a Series B round or eyeing a strategic acquisition, your dashboard will reflect the health and potential of your enterprise. It’s time to stop guessing and start growing with precision. Let’s connect to build your strategic command center.
Command Your Future with Strategic Clarity
Scaling doesn’t have to feel like a gamble. By shifting from reactive reporting to a proactive, real-time framework, you protect your margins and capitalize on market shifts before your competitors see them coming. Your infrastructure must rely on high-integrity data and seamless Sage Intacct integration to turn raw numbers into a roadmap for 2026. This isn’t just about tracking metrics; it’s about building the visibility required to lead with conviction and precision.
At SA Unlimited, we don’t just build reports; we build pathways to profitability. With decades of experience in mid-cap scaling and over $1B in successful client transactions, our team understands the nuances of aggressive growth. As Sage Intacct Certified implementation experts, we bridge the gap between complex financial data and actionable leadership. It’s time to implement a high-performance kpi dashboard for growing business that empowers you to make bold moves with total certainty. We’ll roll up our sleeves and partner with your team to ensure your next stage of growth is both sustainable and record-breaking.
Unlock Your Business Potential with a Strategic KPI Dashboard
Success is waiting on the other side of clarity. Let’s build something extraordinary together.
Frequently Asked Questions
What is the difference between a metric and a KPI for a growing business?
Metrics track the status of specific business processes, while KPIs measure performance against your most critical strategic objectives. Every KPI is a metric, but only about 5% of your data points qualify as KPIs. For example, website traffic is a metric; however, the conversion rate of that traffic into $10,000 contracts is a KPI that drives your bottom line.
How often should a CEO review their KPI dashboard?
A CEO must perform a high level check daily and a comprehensive strategic review every week. Daily reviews catch 24 hour anomalies in cash flow or lead volume before they escalate. Weekly deep dives, usually lasting 60 minutes, allow you to pivot resources and ensure your team stays aligned with the annual growth targets you’ve set.
Can we build a strategic KPI dashboard using only QuickBooks?
QuickBooks Online provides essential accounting data, but it lacks the multi dimensional integration required for a professional kpi dashboard for growing business. While it tracks 100% of your financial entries, it doesn’t natively incorporate CRM data or operational metrics. You need a specialized reporting layer to unlock your business potential and see the full picture of your performance.
What are the first 3 KPIs a scaling company should track?
Scaling companies must prioritize Customer Acquisition Cost (CAC), Lifetime Value (LTV), and Net Burn Rate. Maintaining an LTV to CAC ratio of at least 3:1 ensures your expansion remains profitable over the long term. Monitoring your exact monthly burn rate provides a clear runway date, which empowers you to make bold moves and invest in new opportunities with total confidence.
How much does it cost to implement a professional KPI dashboard with Sage Intacct?
Software subscriptions for Sage Intacct typically start at $15,000 per year according to 2023 industry benchmarks. Professional implementation by a certified partner often adds an initial investment of $10,000 to $30,000. This ensures your data architecture is built correctly from day one, allowing your financial systems to scale seamlessly as you surpass the $50 million revenue mark.
Do I need a full-time CFO to manage my business dashboard?
You don’t need a full time CFO until your annual revenue consistently exceeds $10 million. Until then, a fractional CFO provides the same 20 years of strategic expertise at a fraction of the cost. We roll up our sleeves to manage your kpi dashboard for growing business, providing the clarity you need to lead without the $300,000 executive overhead.
How do I ensure my team actually uses the dashboard data?
Tie 20% to 30% of department head bonuses directly to the specific KPIs displayed on your dashboard. Visibility creates immediate accountability across the entire organization. When every team member sees their performance numbers in real time, they stop relying on guesses. It’s about creating a results oriented culture where data serves as the single source of truth for every decision.
What happens if our dashboard data contradicts our ‘gut feeling’ about the business?
When data and intuition clash, you should trust the data but immediately investigate the underlying causes. Your gut might suggest sales are booming, but the dashboard could reveal a 12% drop in gross margins. We solve for yes by using these hard facts to validate or course correct your instincts. This process transforms uncertainty into a strategic advantage for your company.