
Running a high-growth enterprise with financial data from twenty days ago isn’t leadership; it’s archaeology. If you’re still waiting until the 20th of the month to see last month’s performance, you’re making decisions in the rearview mirror while your competitors are already pivoting for next quarter. At SA Unlimited, we believe you deserve better than conflicting departmental spreadsheets and “best guess” cash runways. Mastering the ceo financial dashboard essentials is no longer a luxury for the Fortune 500. It’s the baseline for any leader who wants to stop reacting to the market and start dictating it.
You likely feel the frustration of data silos, especially when industry reports show that 73% of executives cannot access real-time insights when they need them most. We’re here to solve for yes. This guide will empower you to build a 2026 strategic command centre that transforms static numbers into a real-time single source of truth. We’ll explore the critical KPIs and predictive modeling tools you need to run “what-if” scenarios with total clarity. It’s time to unlock your business potential and gain the confidence to make the bold moves that define industry leaders.
Key Takeaways
- Shift from static reporting to a real-time strategic command center designed to transform your world and empower bold, proactive decision-making.
- Identify the five non-negotiable ceo financial dashboard essentials that track your literal lifeblood, from cash runway to operational efficiency.
- Harness agentic analytics and predictive modeling to move beyond past performance and anticipate future pathways with total clarity.
- Learn why scaling enterprises must transition to the multi-dimensional power of Sage Intacct to maintain a high-level executive view and solve for growth.
- Unlock your business potential by leveraging the expertise of a Fractional CFO to architect a dashboard that turns raw data into a strategic advantage.
Beyond the Scoreboard: What a CEO Financial Dashboard Must Achieve in 2026
Knowing your numbers is the non-negotiable prerequisite for transforming your world. By 2026, the gap between market leaders and those struggling to survive is defined by data latency. A static report is a relic. Your ceo financial dashboard essentials must function as a real-time strategic command centre. This tool provides the visibility needed to scale $1B+ enterprises and empowers you to make bold moves with unwavering confidence. It’s the difference between reacting to a crisis and engineering a victory.
Most executives fall into the lagging indicator trap by focusing solely on what happened last month. While historical data matters, it’s a scoreboard, not a GPS. A modern business dashboard prioritizes leading indicators. These metrics allow you to anticipate market shifts before they impact the bottom line. This proactive posture is the primary tool for high-stakes decision-making and risk mitigation. When you see a 12% dip in pipeline velocity today, you can adjust your strategy before it becomes a revenue shortfall next quarter. We solve for yes by providing the clarity needed to unlock your business potential.
The Death of the Monthly PDF
Waiting for a month-end close is a competitive disadvantage that costs companies millions in missed opportunities. By 2026, the “Continuous Close” is the standard. Real-time data streaming eliminates the 15-day wait for financial reports. Manual reporting errors plague 88% of complex spreadsheets according to research from the University of Hawaii. These inaccuracies undermine executive confidence and lead to flawed strategic choices. Transitioning to automated, real-time feeds ensures your team operates on a single version of the truth, 24/7.
From Data Overload to Strategic Clarity
Data is abundant, but insights are rare. We implement the “Rule of 7” to protect your cognitive bandwidth. Your primary view should only contain seven core pillars that drive your specific business model. Distinguishing between vanity metrics, like social media impressions, and sanity metrics, like customer acquisition cost (CAC) payback periods, is vital. Strategic Clarity is the distillation of complex financial data into actionable intelligence that drives billion-dollar success metrics. This focus allows you to ignore the noise and double down on the levers that actually generate profitable growth.
The 5 Non-Negotiable Pillars of Your Executive Financial View
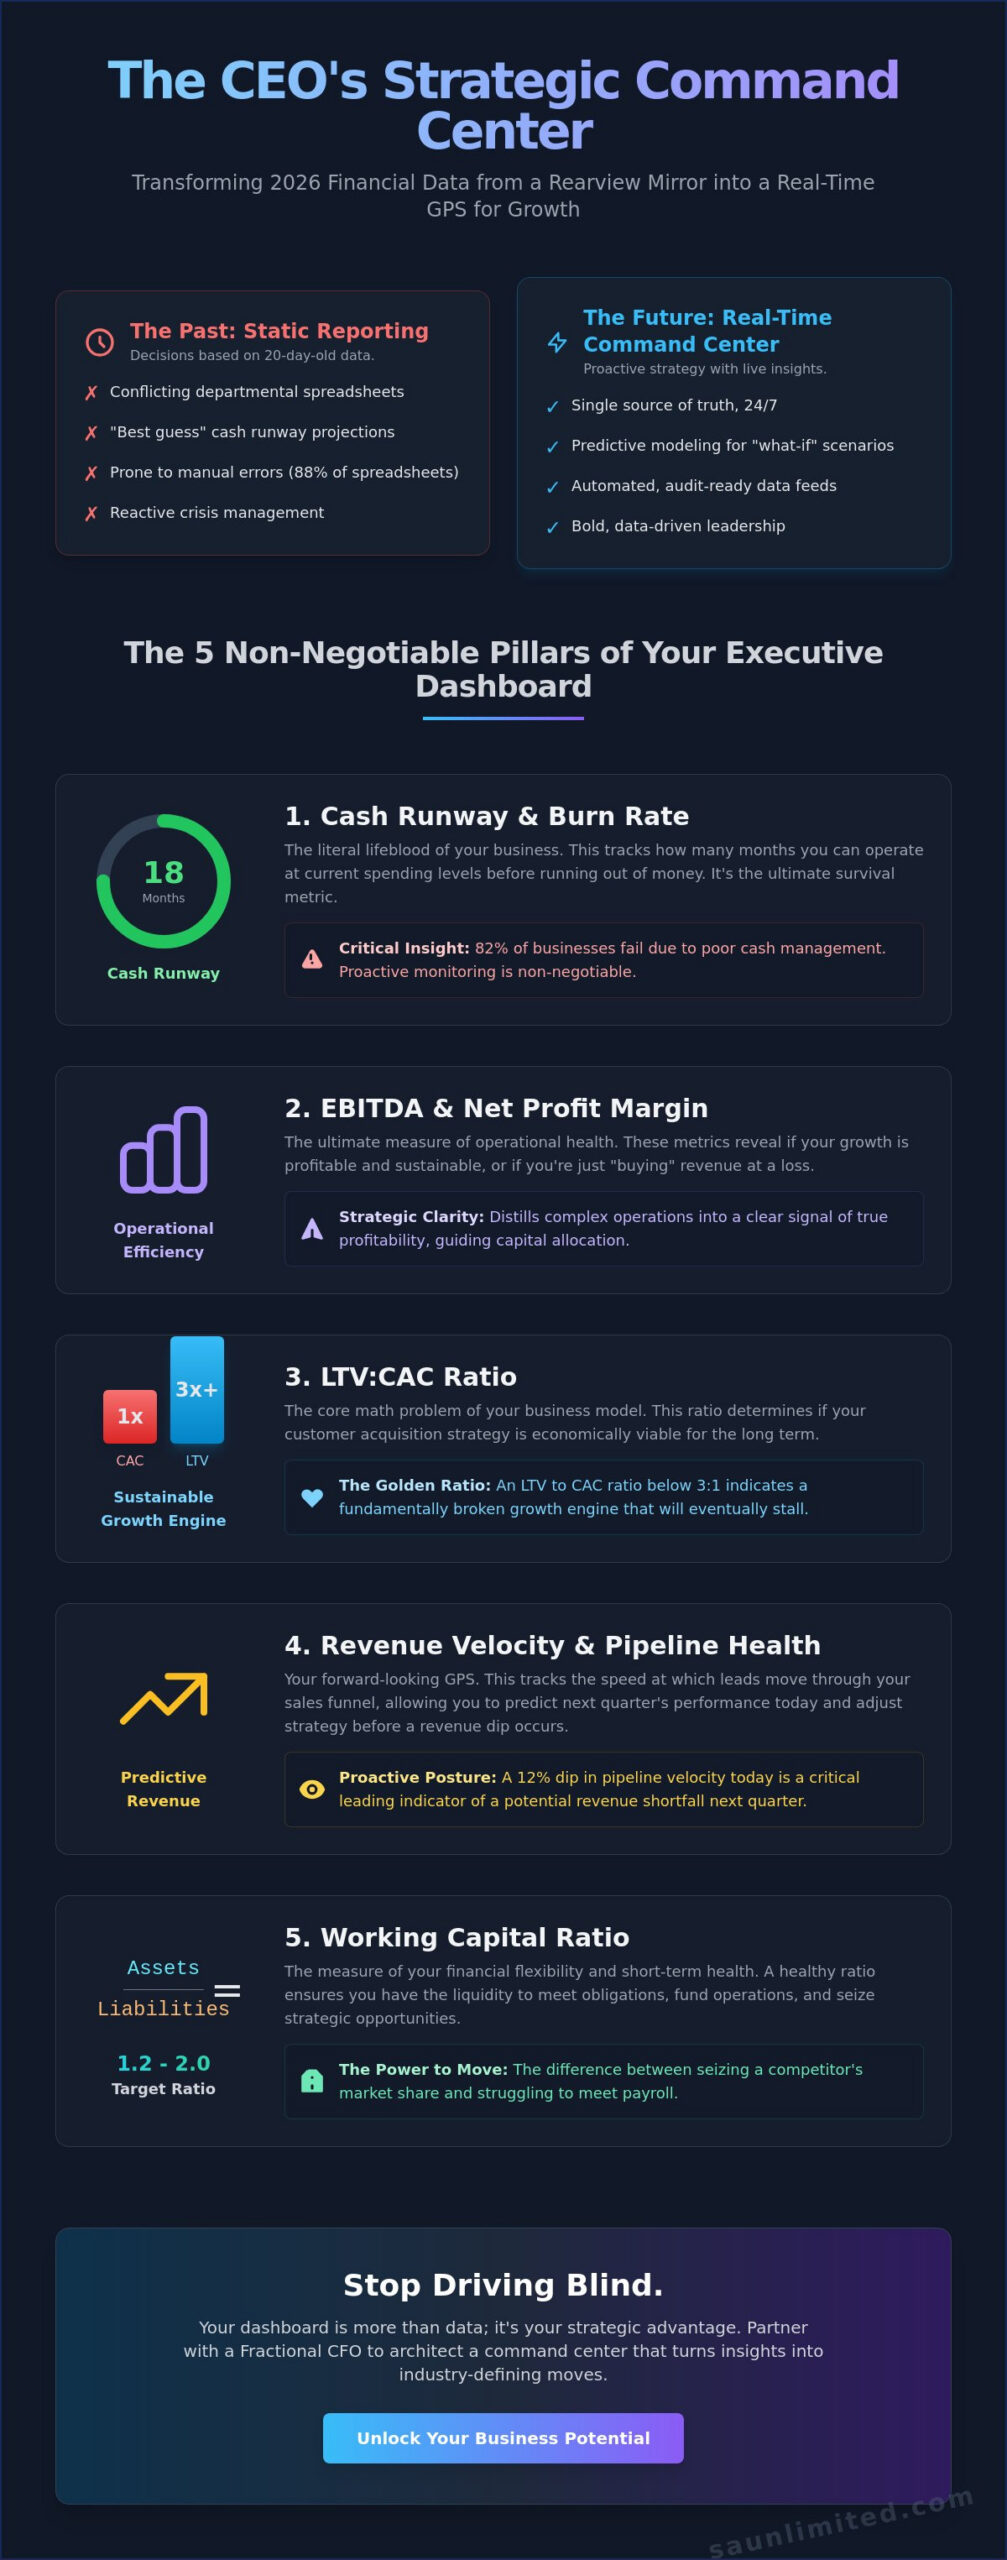
Your dashboard isn’t just a collection of charts; it’s your primary navigation system. To maintain a competitive edge through 2026, your ceo financial dashboard essentials must focus on five core metrics that dictate your company’s trajectory. These pillars provide the clarity needed to lead with conviction rather than reacting to market volatility.
- Cash Runway and Burn Rate: This is the heartbeat of scaling. A 2023 study revealed that 82% of businesses fail due to poor cash management. You need to know exactly how many months of life your business has left at current spending levels.
- EBITDA and Net Profit Margin: These are the ultimate measures of your operational efficiency. They tell you if your growth is sustainable or if you’re simply “buying” revenue at a loss.
- Customer Acquisition Cost (CAC) vs. LTV: Growth is a math problem. If your Lifetime Value (LTV) to CAC ratio isn’t at least 3:1, your growth engine is fundamentally broken and will eventually stall.
- Revenue Velocity and Pipeline Health: This predicts next quarter’s performance today. Tracking the speed at which leads move through your funnel allows you to adjust sales strategies before a revenue dip occurs.
- Working Capital Ratio: Aiming for a ratio between 1.2 and 2.0 ensures you have the liquidity to make bold moves. It’s the difference between seizing a competitor’s market share and struggling to meet payroll.
By integrating these ceo financial dashboard essentials, you transform raw data into a strategic command centre. Adopting financial reporting best practices ensures these numbers are audit-ready, credible, and actionable for your entire leadership team.
Mastering Profitability and EBITDA
Seasoned leaders treat EBITDA as the universal language for valuation. It’s the primary metric investors use to determine what your business is worth in a potential exit or merger. You must track “Adjusted EBITDA” to strip away one-time expenses, providing a truer picture of your core earning power. Expanding these margins by even 3% can increase your valuation multiples by 1.5x during capital raising rounds. This clarity empowers you to justify higher valuations to board members and investors alike.
Cash Flow: Beyond the Bank Balance
Cash on hand is a static snapshot; it doesn’t tell the full story. True liquidity accounts for upcoming obligations and receivables that haven’t hit your account yet. You need to visualize your Cash Conversion Cycle to identify where capital is trapped in inventory or unpaid invoices. A 13-week rolling cash forecast is mandatory for any CEO managing high-growth operations. This tool allows you to predict shortfalls long before they become crises. If you want to unlock your business potential, you must master the art of timing your cash inflows and outflows with surgical precision.
Leveraging AI and Predictive Modeling for Future Pathways
By 2026, the standard for ceo financial dashboard essentials has shifted from historical record-keeping to proactive intelligence. Agentic analytics now serve as your digital sentinel, identifying anomalies in your cash flow or supply chain costs before they escalate into full-blown crises. You’re no longer asking “What happened last month?” Instead, your dashboard answers “What will happen if we pivot now?” This transition from reactive to predictive data allows you to stay two steps ahead of the competition.
Modern dashboards integrate external market data, such as real-time interest rate fluctuations or industry-specific inflation indices, directly into your internal views. This creates a holistic ecosystem where your internal performance is constantly measured against the broader economic climate. It’s about total clarity and the confidence to make bold moves when others are hesitant. When your dashboard identifies a 3% shift in raw material costs across the global market, it automatically adjusts your projected margins, giving you the lead time needed to renegotiate contracts or adjust pricing.
The Power of Scenario Planning
Static budgets are relics of the past. Your dashboard must visualize the “Best Case,” “Worst Case,” and “Most Likely” growth paths with a single click. This level of foresight is how a Fractional CFO helps you “Solve for Yes” by finding the specific financial levers that turn a risky expansion into a calculated win. Predictive Pathing is a competitive moat that uses your proprietary data to outpace market volatility.
- Visualizing Outcomes: View how a 10% increase in labor costs impacts your year-end EBITDA instantly.
- Strategic Advisory: Use automated models to present ironclad cases to your board or investors based on 2026 market projections.
- Risk Mitigation: Identify the “breaking point” in your cash reserves during potential market downturns before they occur.
AI-Driven Variance Analysis
Traditional Budget vs. Actual (BvA) reports are often outdated by the time they reach your desk. AI-driven systems automate this process, flagging departmental overspending the moment it occurs. If the marketing team exceeds their digital ad spend by $5,000 on a Tuesday, you’ll know by Wednesday morning. This immediate feedback loop reduces the “Decision Gap,” the dangerous period between an event and the leadership’s response, which often lasts 15 to 30 days in legacy organizations. Real-time insights empower you to unlock your business potential by keeping every dollar aligned with your strategic goals.
Impact of Automated Insights:
- Eliminate manual data entry errors that currently plague 88% of corporate spreadsheets.
- Redirect capital from underperforming channels to high-growth opportunities in real-time.
- Provide department heads with instant accountability through automated alerts and ceo financial dashboard essentials.
Building the Infrastructure: Why Sage Intacct is the Mid-Cap Standard
Growth creates complexity that kills basic accounting software. While QuickBooks serves its purpose for early-stage ventures, 80% of mid-cap firms find it becomes a bottleneck once they hit $10 million in annual revenue or manage more than three entities. To master ceo financial dashboard essentials, you need a foundation that doesn’t just record history but predicts the future. This is where Sage Intacct becomes the non-negotiable standard for ambitious CEOs.
At the core of this infrastructure is a multi-dimensional general ledger. Traditional systems rely on a bloated, linear chart of accounts that makes granular analysis impossible. Sage Intacct uses dimensions to tag every transaction with context, such as location, department, or project. This creates a “Single Source of Truth” where you can slice and dice data without ever touching a spreadsheet. It’s the difference between seeing a “Marketing Expense” and seeing “Q3 Customer Acquisition Cost for the Northeast Region.”
True clarity requires a connected ecosystem. Sage Intacct integrates seamlessly with your CRM, payroll, and banking platforms. When your Salesforce data talks directly to your finance system, you eliminate the manual entry errors that often lead to $50,000 discrepancies. You gain a real-time pulse on your cash flow and burn rate, ensuring your ceo financial dashboard essentials are powered by live data, not month-old echoes.
Implementing for Scalability
Success isn’t found in a “set it and forget it” mentality. Most firms fail because they treat software implementation as a one-time IT task rather than a strategic evolution. Expert Sage Intacct implementation consultants are essential for building the custom KPIs that reflect your unique unit economics. They ensure your architecture is built to handle a 5x increase in transaction volume. We solve for yes by designing systems that grow with your ambition, not against it.
Custom Reporting for Multi-Entity Growth
Managing five or more entities can turn a simple board meeting into a week-long preparation nightmare. Sage Intacct automates inter-company eliminations and currency conversions, typically saving finance teams 20 to 40 hours during the monthly close. You can view consolidated financials for the entire enterprise or drill down into a specific department view with two clicks. This level of transparency empowers you to make bold moves with unwavering confidence.
Ready to transform your financial command centre? Unlock your business potential and build the infrastructure your growth deserves.
Unlocking Your Business Potential: The Strategic Partner Behind the Data
Data alone won’t scale your company to the next level. While mastering ceo financial dashboard essentials is a prerequisite for modern leadership, a dashboard is only as effective as the strategy it informs. You can have the most sophisticated visualizations in the world, but without a pilot who knows how to navigate the turbulence, those metrics are just pixels on a screen. At SA Unlimited, we view the Fractional CFO as the architect of your financial command centre. This role goes beyond balancing ledgers; it’s about building the infrastructure that supports aggressive expansion.
We move your organization from reactive accounting to proactive strategic advisory. Most firms focus on what happened last month. We focus on what’s possible next year. Our philosophy is simple: we solve for yes. When you present a bold move, we don’t just look for reasons to say no. We interpret your data to find the path that makes that move profitable. We roll up our sleeves to ensure your financial systems aren’t just reporting history but are actively creating your future.
The ROI of Strategic Financial Oversight
Expert interpretation is the difference between a calculated risk and a blind gamble. Research indicates that companies using data-driven insights are 23 times more likely to acquire customers and 19 times more likely to be profitable. By eliminating “gut-feeling” mistakes that often lead to 15% or higher budget variances, a strategic partner pays for themselves many times over. We don’t just hand you a report; we build the pathways that lead to your goals. The Strategic CFO is the CEO’s most critical ally, transforming raw data into a roadmap for aggressive, sustainable growth.
Next Steps: From Insight to Action
Transitioning to a high-performance reporting environment doesn’t happen overnight, but it can happen in 30 days. Your roadmap to clarity starts with an audit of your current reporting health to identify where ceo financial dashboard essentials are missing or broken. Follow this 30-day sprint:
- Days 1-10: Audit existing data silos and eliminate redundant or conflicting KPIs.
- Days 11-20: Cleanse data streams and integrate your tech stack for real-time accuracy.
- Days 21-30: Deploy a tiered outsourced CFO model that scales with your revenue milestones.
The complexity of 2026 demands more than just a spreadsheet. It requires a command centre built for speed and a partner built for results. Let’s connect to unlock your business potential.
Master Your Strategic Command Centre
The 2026 landscape demands more than just a glance at last month’s profit and loss statement. Your success depends on moving from reactive reporting to proactive, AI driven predictive modeling that anticipates market shifts before they happen. By integrating the five non-negotiable pillars into your executive view, you transform raw data into a clear, actionable pathway for growth. Standardizing your operations on Sage Intacct ensures your team operates with the precision required for mid-cap excellence. Mastering these ceo financial dashboard essentials gives you the clarity to make bold moves with absolute confidence.
At SA Unlimited, we bring decades of experience and a proven track record of $1B+ in success metrics to your corner. We’re Sage Intacct implementation experts who don’t just provide software; we provide a strategic partnership built on our “We Solve for Yes” mindset. It’s time to roll up our sleeves and unlock your business potential together. Let’s connect to build your strategic command centre and ensure your organization is ready for the future. Your next era of profitable growth starts with the right data at your fingertips.
Frequently Asked Questions
What is the difference between a CEO dashboard and a CFO dashboard?
A CEO dashboard focuses on strategic trajectory and high-level growth metrics, while a CFO dashboard monitors granular operational efficiency and regulatory compliance. The CEO needs to see the “why” behind the numbers to make bold moves; the CFO tracks line-item variances and cash flow cycles to ensure fiscal stability. We solve for yes by aligning these views so the leadership team moves in unison toward 2026 targets.
How often should a CEO check their financial dashboard?
You should check your primary vitals daily and conduct a deep-dive review every week. Real-time data allows you to pivot before a minor trend becomes a 15% revenue leak. Most high-performing CEOs review their command center every morning for 10 minutes to set the day’s strategic intent. This consistency transforms data into a competitive advantage and builds unwavering confidence in your decision-making process.
Can I build a CEO dashboard in Excel or do I need specialized software?
You can build a basic version in Excel, but scaling to a professional command center requires specialized BI software like Power BI or Tableau. Excel often leads to manual errors; in fact, 88% of spreadsheets contain mistakes according to a University of Hawaii study. To unlock your business potential, you need automated data pipelines that eliminate “garbage in, garbage out” risks. Specialized tools provide the cutting-edge technology necessary for the 2026 strategic landscape.
What are the best KPIs for a SaaS CEO dashboard vs. a manufacturing CEO dashboard?
SaaS CEOs must prioritize LTV/CAC ratios and Monthly Recurring Revenue (MRR) growth, while manufacturing CEOs focus on Overall Equipment Effectiveness (OEE) and inventory turnover. For a SaaS firm, a churn rate below 5% is a critical health marker. In manufacturing, reducing scrap rates by 3% can significantly impact the bottom line. These ceo financial dashboard essentials ensure you’re tracking the specific levers that drive your unique industry growth.
How much does it cost to implement a professional financial dashboard system?
Professional implementation costs vary based on complexity, but industry benchmarks from Gartner suggest mid-market firms spend between $10,000 and $50,000 for initial BI setup. This investment covers data architecture, integration, and custom visualization. While the upfront cost exists, the ROI is realized through identifying 20% more growth opportunities. We view this not as a cost center, but as a strategic asset to unlock your business potential.
What is the “Rule of 40” and should it be on my dashboard?
The Rule of 40 is a metric stating a software company’s combined growth rate and profit margin should exceed 40%. It’s a gold standard for balancing aggressive expansion with fiscal discipline. You should absolutely include it on your dashboard to demonstrate strategic health to investors. Maintaining this ratio signals you’ve built a sustainable engine capable of achieving billion-dollar success metrics in the long term.
How do I ensure my dashboard data is accurate and not “garbage in, garbage out”?
Ensure accuracy by implementing strict data governance and direct API integrations between your ERP and your dashboard. Manual entry is the enemy of clarity because it introduces human error that can skew results by 10% or more. By automating the flow, you create a single source of truth. This proactive approach ensures your ceo financial dashboard essentials provide the reliable insights you need to make bold, strategic moves.